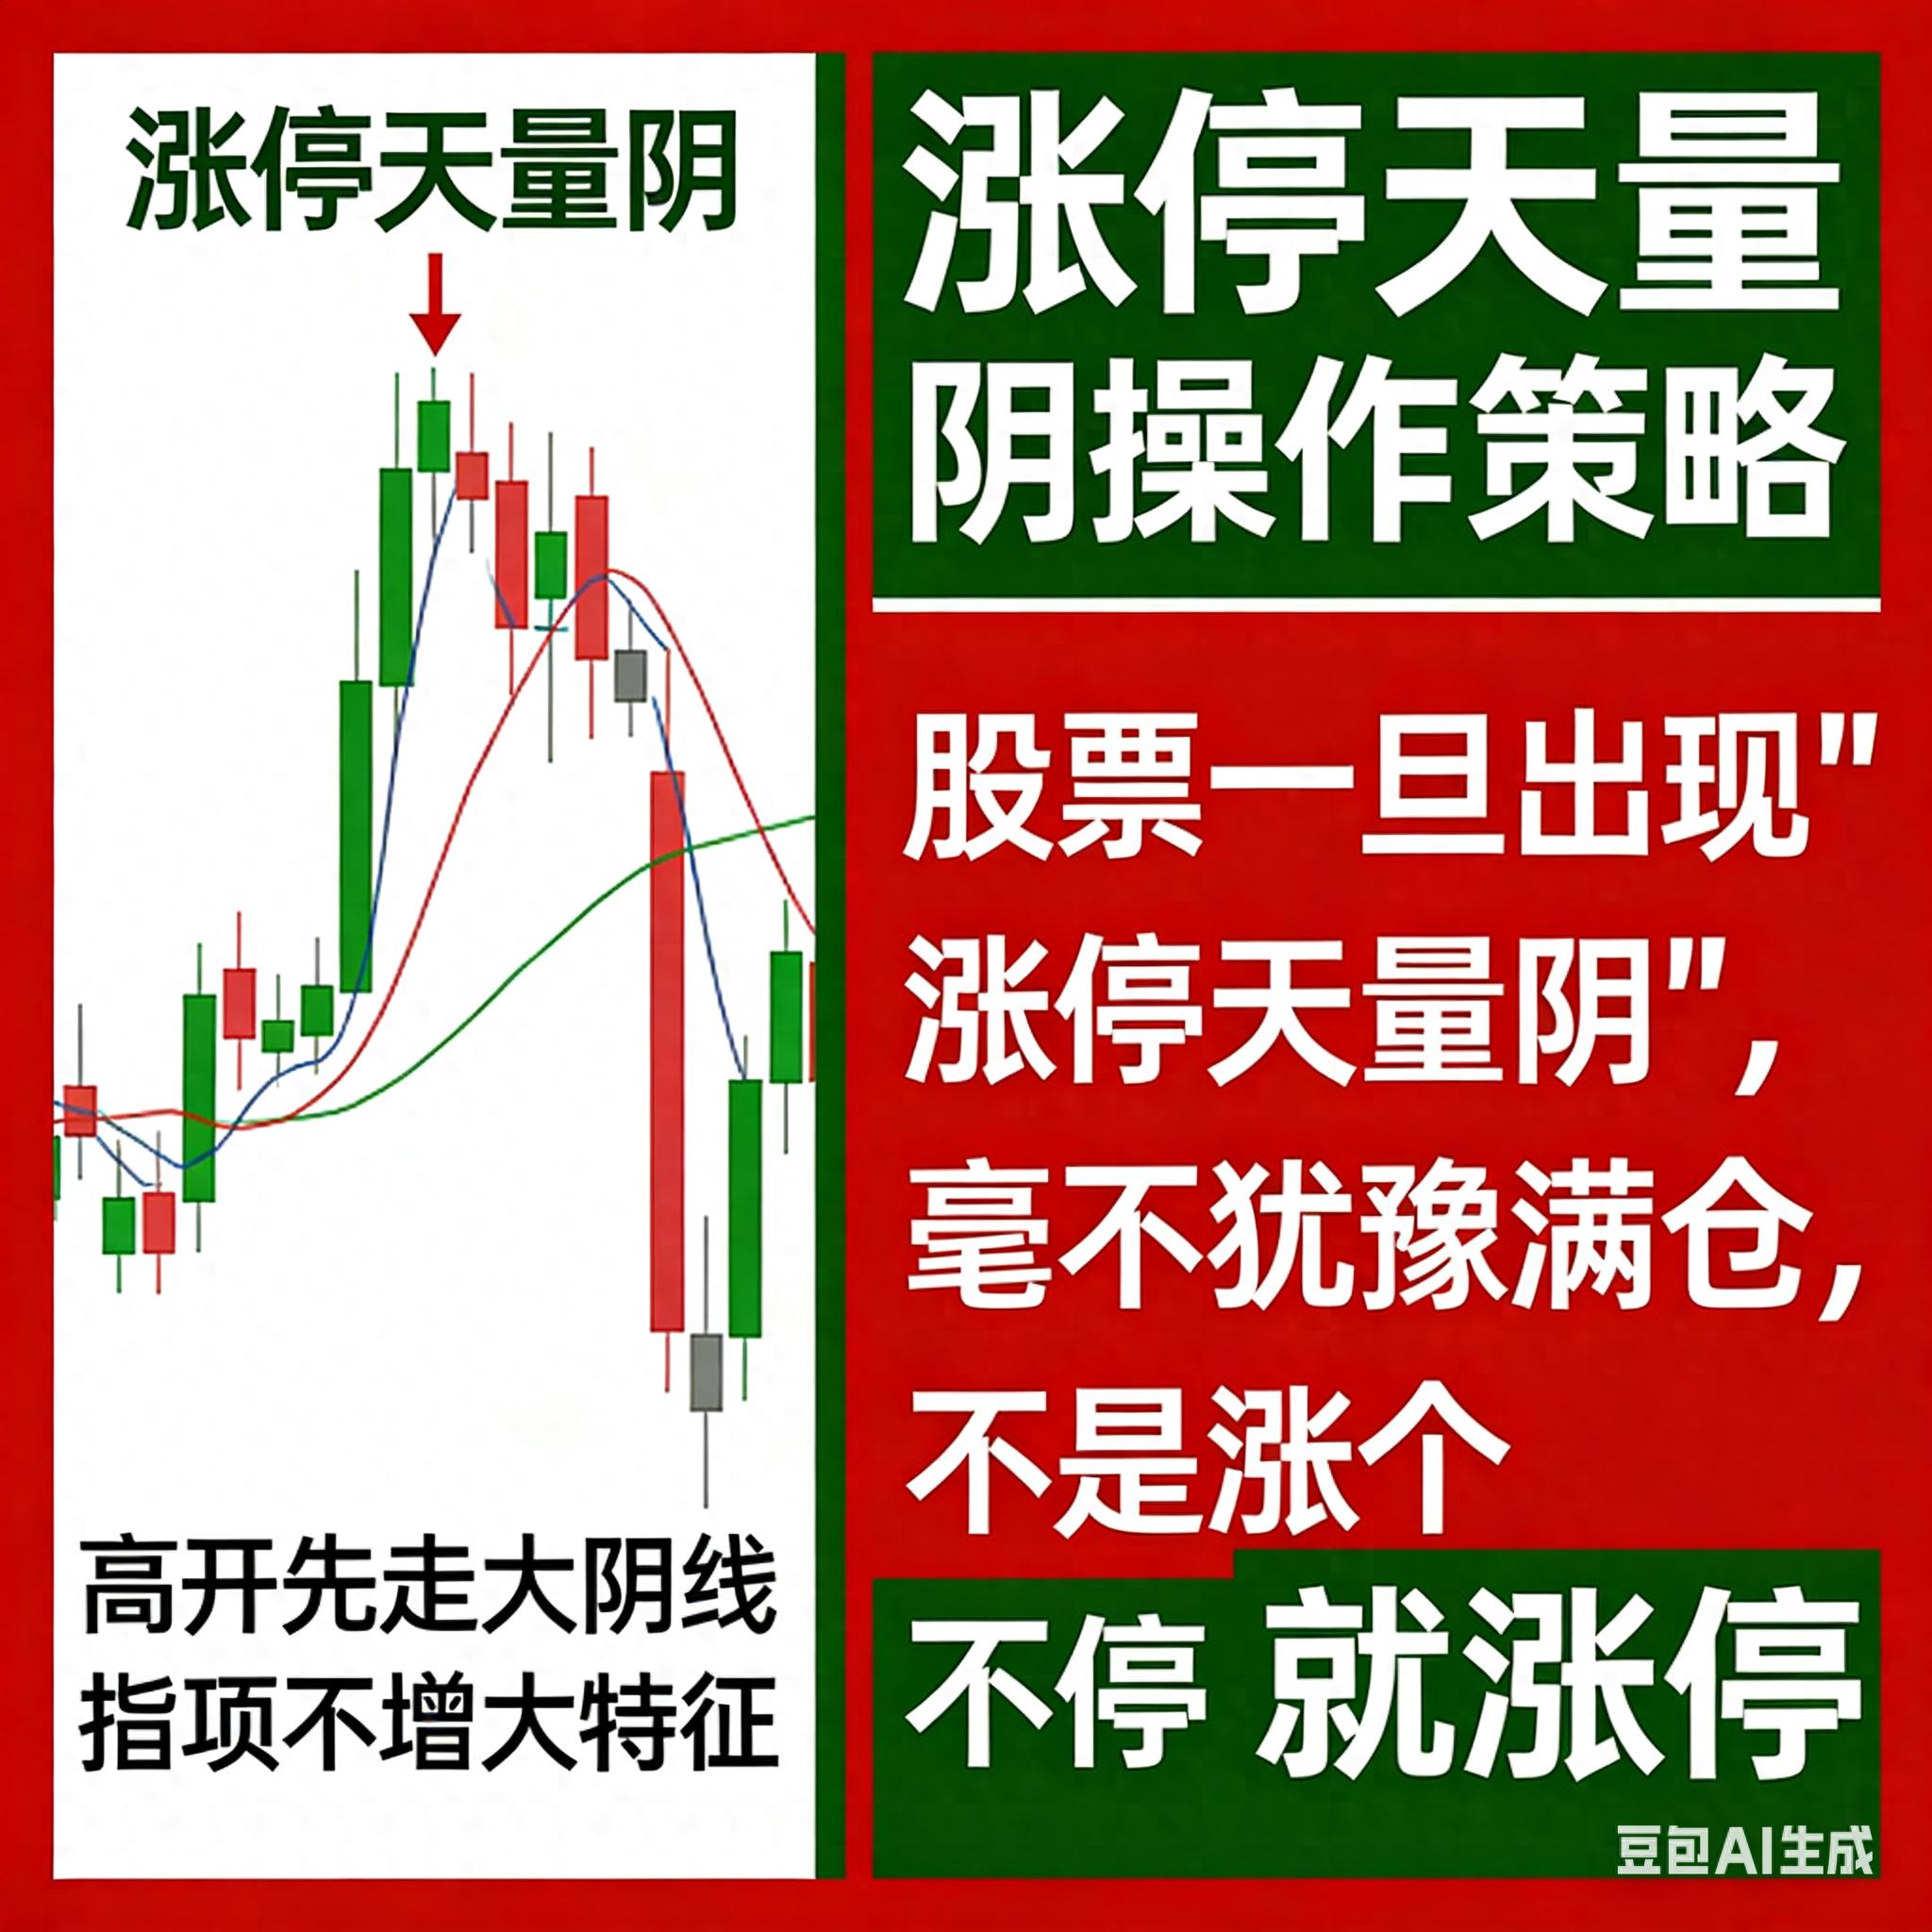
On February 7, A-shares continued to fluctuate. Many stocks that had previously hit the daily limit suddenly opened higher and moved lower, and closed with huge negative lines. A certain AI concept stock hit the daily limit strongly the day before, and the volume dropped 5% the next day. The trading volume was twice as high as the day of the daily limit. A certain infrastructure stock opened lower and moved lower the next day after hitting the daily limit. The huge negative line caused retail investors to panic and cut their losses. As a result, the stock price rebounded quickly in late trading, completely undermining the subsequent market.
This trend of "high volume and sharp fall after the daily limit" has put 250 million retail investors in a collective dilemma: Is it a trap for the main force to ship goods, or is it a gold pit for a washout? In fact, this is the famous "high limit and negative" form in short-term trading of A-shares – a form that truly meets the standard. It will either continue to rise or hit the limit again. However, because most retail investors do not know how to distinguish, they either miss the opportunity or fall into a trap. Today, we will use vernacular to dismantle the core logic, screening criteria and practical steps of this form, combined with practical cases from 2025 to 2026, to help you accurately grasp opportunities and avoid traps.
1. First understand: What is "the daily limit is negative"? Three hard standards are indispensable
Many retail investors regard any negative line of heavy volume after the daily limit as "low volume on the day of the daily limit". This is the most fatal misunderstanding. The real "high limit day and negative amount" is a washout signal before the main force pulls up. It has strict morphological requirements. Three hard standards must be met at the same time. Any missing one may be a trap:
1. Prefix: must be "effective daily limit", not false daily limit
The daily limit is the basis of the pattern, but not all daily limits are meaningful. The core of an effective daily limit is to "pull up real money", which meets two conditions:
– Trading limit time: It is best to close the market within 1 hour of early trading, open the market no more than 2 times throughout the day, and the volume of closed orders is at least 1% of the circulating market, indicating that the main force is strong and determined;
– Volume and energy coordination: The trading volume on the daily limit day is more than 50% larger than the average volume in the past five days, to avoid a straight board with no trading volume (the main force has no chance to change hands, and subsequent negative lines are mostly shipments).
For example, on January 8, 2026, a certain semiconductor stock had its daily limit locked for half an hour in early trading, with 80 million shares closed (800 million shares in circulation). The market was not opened for the whole day, and the trading volume was 420 million, which was 60% higher than the average volume in the past five days. This is It is a standard effective daily limit; but in December 2025, a certain consumer stock unexpectedly hit the daily limit in the last 5 minutes of late trading. The trading volume for the whole day was only 120 million, which was lower than the average volume in the past five days. The subsequent negative line is a typical shipment and is not considered an effective form.
2. Core: The Yin line carries "real strength", and the difference must be sufficient
A negative line appears within 1-3 days after the daily limit, and the trading volume must meet the "day volume" standard:
– Volume energy scale: The daily trading volume of the negative line is 1.5-3 times that of the daily limit day, and the volume ratio is between 2.2-4.2. This is a signal that the long-short divergence has reached its peak;
– The significance of volume energy: If the volume energy is too small (less than 1.5 times), it means that the differences are not enough, and the main force's washing up is insufficient; if the volume energy is too large (more than 3 times), the main force may be crazy to ship, and the risk is extremely high.
On January 9, 2026, the above-mentioned semiconductor stocks opened 2% higher and then fluctuated and fell, closing the negative line with a decrease of 4%. The trading volume was 680 million, which was exactly 1.6 times of the daily limit day, which met the sky volume standard; and in November 2025, the trading volume of a new energy stock the next day after the daily limit was 3.8 times that of the daily limit day, which was excessive volume. The subsequent stock price fell by 25%, which was a signal for major shipments.
3. Key: Hold the support level and not fall below the main bottom line
This is the core of distinguishing between washing and shipping. The support level is the main cost line. If it holds, it means washing, and if it falls below, it means shipping:
– Core support: The closing price of the negative line cannot fall below half of the previous day's daily limit price, nor can it fall below the 5-day moving average or the opening price on the day of the daily limit;
– Intraday performance: Even if the price falls below the support level briefly during the day, it will be quickly pulled back by a large buy order, forming a "false breakthrough", which will not allow OTC funds to pick up cheap chips.
The closing price of the above-mentioned semiconductor stocks on January 9 happened to stand on the 5-day moving average, and did not fall below the daily limit opening price, showing solid support. However, in October 2025, the negative line closing price of a certain theme stock the next day after the daily limit fell below half of the daily limit price, and fell below the 5-day moving average. Subsequently, it directly pulled back 20%, which is a shipping pattern.
To sum up, the essence of "the daily limit is negative" is that "the main force takes advantage of the huge divergence to wash the market." The three standards are closely related, and any missing one may be a trap. This is also the premise of "full position without hesitation" – not all the daily limit is negative can be bought, only those that meet the standards are opportunities.
2. Underlying logic: Why does the main force want to engage in "high limit and sky limit"? The essence is "sifting leeks"
When retail investors see a sharp drop in volume after the daily limit, their first reaction is "the main force has run away", but in fact this is a washout routine carefully designed by the main force. There are three clear purposes behind it. If you understand it, you will no longer panic:
1. Raising the daily limit is "eye-catching": attracting retail investors to enter the market, so that there are chips to wash.
The main force spent real money to raise the daily limit, not for charity, but to quickly attract the market's attention. The daily limit is the focus of market sentiment, which can make retail investors feel that "this ticket has a market price", and a large number of short-term speculative orders will swarm in. The main force needs these retail investors to enter the market, so that there will be chips to wash in subsequent washes. Otherwise, no one will hand over the chips, and there will be a lot of selling pressure when pulling up.
2. "Intimidation" by smashing the negative line: creating panic and forcing out unstable floating chips
After the daily limit, retail investors have floating profits, and most of them "run when they make a profit, and panic when they lose a little." The main force deliberately opens high and moves low to release huge amounts, creating the illusion that "the main force is shipping and the market is over", allowing two types of retail investors to hand over their chips:
– Timid retail investors: When they see heavy volume and plummet, they are afraid of taking profits and quickly cut their losses and leave the market;
– Greedy retail investors: Thinking it is a bargain-hunting opportunity, they blindly enter the market to take over the market, but are unable to withstand the subsequent shocks and take advantage of the situation;
The main force quietly takes over these chips at a low position, completes the concentration of chips, and clears the way for subsequent increases.
3. Maintain the "bright bottom line" of support: implying that the market washout is over and the price is about to rise.
The main purpose of the market wash is to clear out retail investors, not to destroy the stock price. Holding the 5-day moving average or the daily limit opening price is to tell the market, "This is my cost area, and I cannot let OTC funds take advantage of it." It also sends a signal to long-term investors who are optimistic about the stock: the washout is about to end, and a subsequent increase will follow.
The "Market Trading Behavior Analysis Report" released by the Shenzhen Stock Exchange in 2025 shows that 568 stocks in the Shanghai and Shenzhen Stock Exchanges throughout the year had a standard "high limit and negative volume" pattern before the main rise was launched. 67% of the stocks rose by more than 10% in the following five trading days. This shows that as long as the form is authentic, the probability of subsequent rises is much greater than that of declines.
3. Verification of historical data: What is the winning rate for a standard "trading daily limit"?
After reviewing the A-share market from 2021 to 2025, we screened out 128 stocks that meet the three major criteria of "high limit, daily limit, negative volume", and combined with their subsequent trends, we obtained a set of key data to prove the effectiveness of this pattern with facts:
1. Probability and rate of increase: efficient in the short term, stable in the long term
– The probability of rising in the next three trading days is 72.6%, with an average rise of 8.3%, of which 23% of stocks directly hit the daily limit;
– The probability of increase in the next 10 trading days is 76.2%, with an average increase of 15.7%. If the superimposed policies are beneficial to the track, the winning rate will soar to 82.1%;
– The probability of an increase in the next 30 trading days is 68.8%, with an average increase of 23.5%, indicating that this form is not only effective in the short term, but can also bring considerable benefits in the long term.
Compared with retail investors who blindly chased the daily limit during the same period, 89% suffered losses, and 73% of the losses were due to the negative trend after the daily limit. This shows that learning to identify patterns can significantly outperform ordinary retail investors.
2. Influence of key points: support levels determine success or failure
– For stocks holding the 5-day moving average, the probability of rising in the next 10 trading days is 83.5%, with an average growth rate of 18.2%;
– For stocks that hold their daily limit opening price but fall below the 5-day moving average, the probability of rising is reduced to 65.1%, with an average rise of 11.3%;
– For stocks that fall below the 5-day moving average and the daily limit opening price at the same time, the probability of rising is only 27.3%, and the average decline is 7.8%.
This set of data shows that the support level is the core of the effectiveness of the form. If you hold the key support, the probability of rising will be greatly increased; once it falls below, it will turn from an opportunity into a trap.
3. Positional influence: Low positions are golden pits, high positions are traps
– If the stock price rises no more than 30% from the low point within half a year (low level), and after the daily limit is negative, the probability of rising is 89.2%, with an average rise of 25.6%;
– The cumulative increase in stock price exceeds 50% (high level). After the pattern appears, the probability of increase is only 31.5%, and the average decrease is 12.3%.
In January 2026, a certain photovoltaic stock traded sideways at the bottom for 2 months, then the daily limit was negative, and the cumulative increase was only 22%, and it rose 40% in the following 10 days; while in August 2025, a popular track stock rose 60%, then the daily limit was negative, and then it fell back directly by 25%. This is the difference caused by the position.
4. Practical suggestions: 3 iron rules, don’t step into pitfalls if you have a full position
Article 1: Strictly screen patterns and avoid fuzzy signals
things to do
1. Establish a screening list. Each candidate stock is compared with the three major criteria of "effective daily limit, true daily volume, and sustained support". Only if all are met, it will be included in the observation pool. All of them are indispensable;
2. Based on the stock price position, give priority to stocks that are at low prices (cumulative increase ≤30%) and stocks that have reached their first daily limit after trading sideways at the bottom, and avoid stocks that have doubled at high prices;
3. Check the theme logic, select stocks with continued favorable policies or performance support (such as semiconductors and infrastructure in 2026), and avoid pure theme stocks without substantial support.
Things not to do
1. Do not target the straight line or the negative line after the late trading limit attack. The probability of subsequent shipments in this type of form is extremely high;
2. Do not touch stocks that are excessively heavy in volume (exceeding the daily limit by 3 times) or stocks that have lost their support level. Even if the shape seems close, give up resolutely;
3. Do not ignore the realization of the theme. If the price limit is due to sudden news, and the news has been realized, the subsequent outgoing volume will mostly be shipments, and you cannot intervene.
Article 2: Wait for the confirmation signal and don’t rush to fill the position
things to do
1. After Tianliangyin appears, do not enter the market on the same day, but wait for confirmation signals within 3 trading days: the stock price shrinks and stabilizes (the trading volume drops to less than 50% of the Tianliang day), and recovers more than 50% of the Tianliangyin entity, or returns to the 5-day moving average;
2. Adopt a strategy of building a position in batches: after the signal is confirmed, 50% of the position will be opened for the first time; when the stock price breaks through the negative high point, an additional 30% of the position will be added; the remaining 20% of the funds will wait for the callback to confirm the support and then cover the position to avoid the risk of full position at one time;
3. Set a clear stop loss level: Use the stop loss line 1% below the lowest price of Tianliangyin or the 5-day moving average. If it does not recover within 3 days after falling below, stop the loss immediately and leave the market. The single loss should be controlled at 2%-3% of the total capital.
Things not to do
1. If you don’t catch up with the cloudy sky on that day, there will be a big difference between long and short on that day, and the stock price will fluctuate violently, it is easy to get trapped in a high position if you enter the market blindly;
2. If you are dissatisfied with the position stud, no matter how standard the form is, you must retain some funds to deal with subsequent fluctuations and avoid black swan risks;
3. Don’t stop losing and carry orders. The support level is the bottom line of the main force. Once it falls below, it means that the main force is not willing to protect the market. Continuing to hold will only expand losses.
Article 3: Pay attention to subsequent trends and take profits flexibly
things to do
1. Take profit in stages: reduce the position by 20% when the profit reaches 10%, reduce the position by 30% when the profit reaches 20%, reduce the position by 40% when the profit reaches 30%, and the remaining 10% position depends on the trend;
2. Trend following: If the stock price continues to rise on heavy volume and does not fall below the 10-day moving average, you can continue to hold it; if there are signals such as a heavy volume decline or high stagflation, clear the position decisively;
3. Review optimization: record the morphological characteristics, entry price, take-profit and stop-loss levels after each transaction, conduct regular reviews, summarize which types of patterns have higher winning rates, and optimize screening criteria.
Things not to do
1. Don’t be greedy for too much, and reduce your position promptly after reaching the target take-profit level to avoid profit taking;
2. Do not frequently exchange stocks due to short-term fluctuations. After confirming the signal, hold it patiently to the take-profit or stop-loss position to avoid being swayed by the main force's washout rhythm;
3. Do not ignore the market environment. If the market as a whole is in a downward trend, even if the shape is standard, you need to reduce your position or give up to avoid systemic risks.
5. Common misunderstandings clarified: avoid these pitfalls and double your winning rate
Misunderstanding 1: All positions can be full if the volume is negative on all daily limit days
This is the most dangerous misunderstanding. Only a form that meets the three major criteria of "effective daily limit, real volume, and maintaining support", is at a low level, and has thematic support is worthy of layout; a form that is at a high level, excessive volume, and has lost support is essentially a shipping trap, and a full position will only be trapped.
Misunderstanding 2: Entering the market on a cloudy day to seize the low price
On a cloudy day, the differences between long and short are greatest, the stock price fluctuates violently, and the main force is still washing the market. Entering the market on that day is equivalent to playing a game in chaos, and the winning rate is extremely low. The correct approach is to wait for the confirmation signal within 3 trading days, and then enter the market after the washout is over. Although the cost may be higher, the risk is greatly reduced.
Misunderstanding 3: Ignore the market environment and only look at individual stock patterns
No matter how strong the shape of individual stocks is, it is difficult to go against the trend of the market. If the market is in a bear market or a volatile downward stage, the overall market sentiment is sluggish, and the main force's willingness to pull up is weak. Even if the standard daily limit is negative, the probability of subsequent rises will be significantly reduced. At this time, you should give priority to wait and see rather than force entry.
Misunderstanding 4: Still having illusions after falling below the support level
The support level is the cost line of the main force. If it falls below, it means that the main force has failed to protect the market or has no intention of protecting the market. It is most likely a signal for shipment. At this time, you cannot have the illusion of "wait a little longer and it will rebound" and you should stop the loss decisively to avoid expanding the loss.
6. Conclusion
"The daily limit is overcast" is not a signal to blindly fill up positions, but a golden opportunity given by the main force to those who are prepared. Its core logic is "a huge amount of divergence washes the market, and the chips are concentrated to pull up." As long as you strictly screen the patterns, wait for confirmation signals, and control the pace of positions, you can accurately grasp the subsequent rising market.
What retail investors lack in stock trading is not opportunities, but the ability to identify opportunities and the discipline to control them. The reason why many people get into trouble with the daily limit-day volume negative form is that they either don’t understand the identification criteria and regard shipments as a wash; or they are eager for success and blindly enter the market on the same day; or they have no stop loss discipline and still hold on if it falls below the support.
Remember, the real short-term master does not seize all opportunities, but only seizes the most certain opportunities. Although the form of "the daily limit is high and the amount is negative" is simple, behind it lies the capital game and human calculation of the main force. Only by thoroughly understanding the standards and observing discipline can we find the password to make money in this seemingly panic trend and achieve the profit goal of "either the price keeps rising or the price rises."
Disclaimer
The content of this article is based on 20 years of practical experience in the stock market, 2021-2025 A-share historical data, and 2025-2026 practical case summary. It is only a sharing of trading skills in the "high limit, sky, and negative" pattern, and does not constitute any investment advice, individual stock recommendation, or trading guidance. The A-share market is affected by multiple factors such as macroeconomic policies, capital flows, and external markets. Historical winning rates do not represent future performance, and morphological signals may also become invalid due to market changes. Investors need to make independent decisions based on their own risk tolerance, trade through formal brokerage channels, and strictly set stop losses and profits. According to this operation, they are responsible for their own profits and losses and risks.
Topic discussion
Have you ever encountered the "high limit, sky, and negative" pattern before? Is it washing dishes or shipping? What was the result of your operation at that time? What do you think is the most critical point of identification for this form? Welcome to share your experiences and opinions in the comment area!