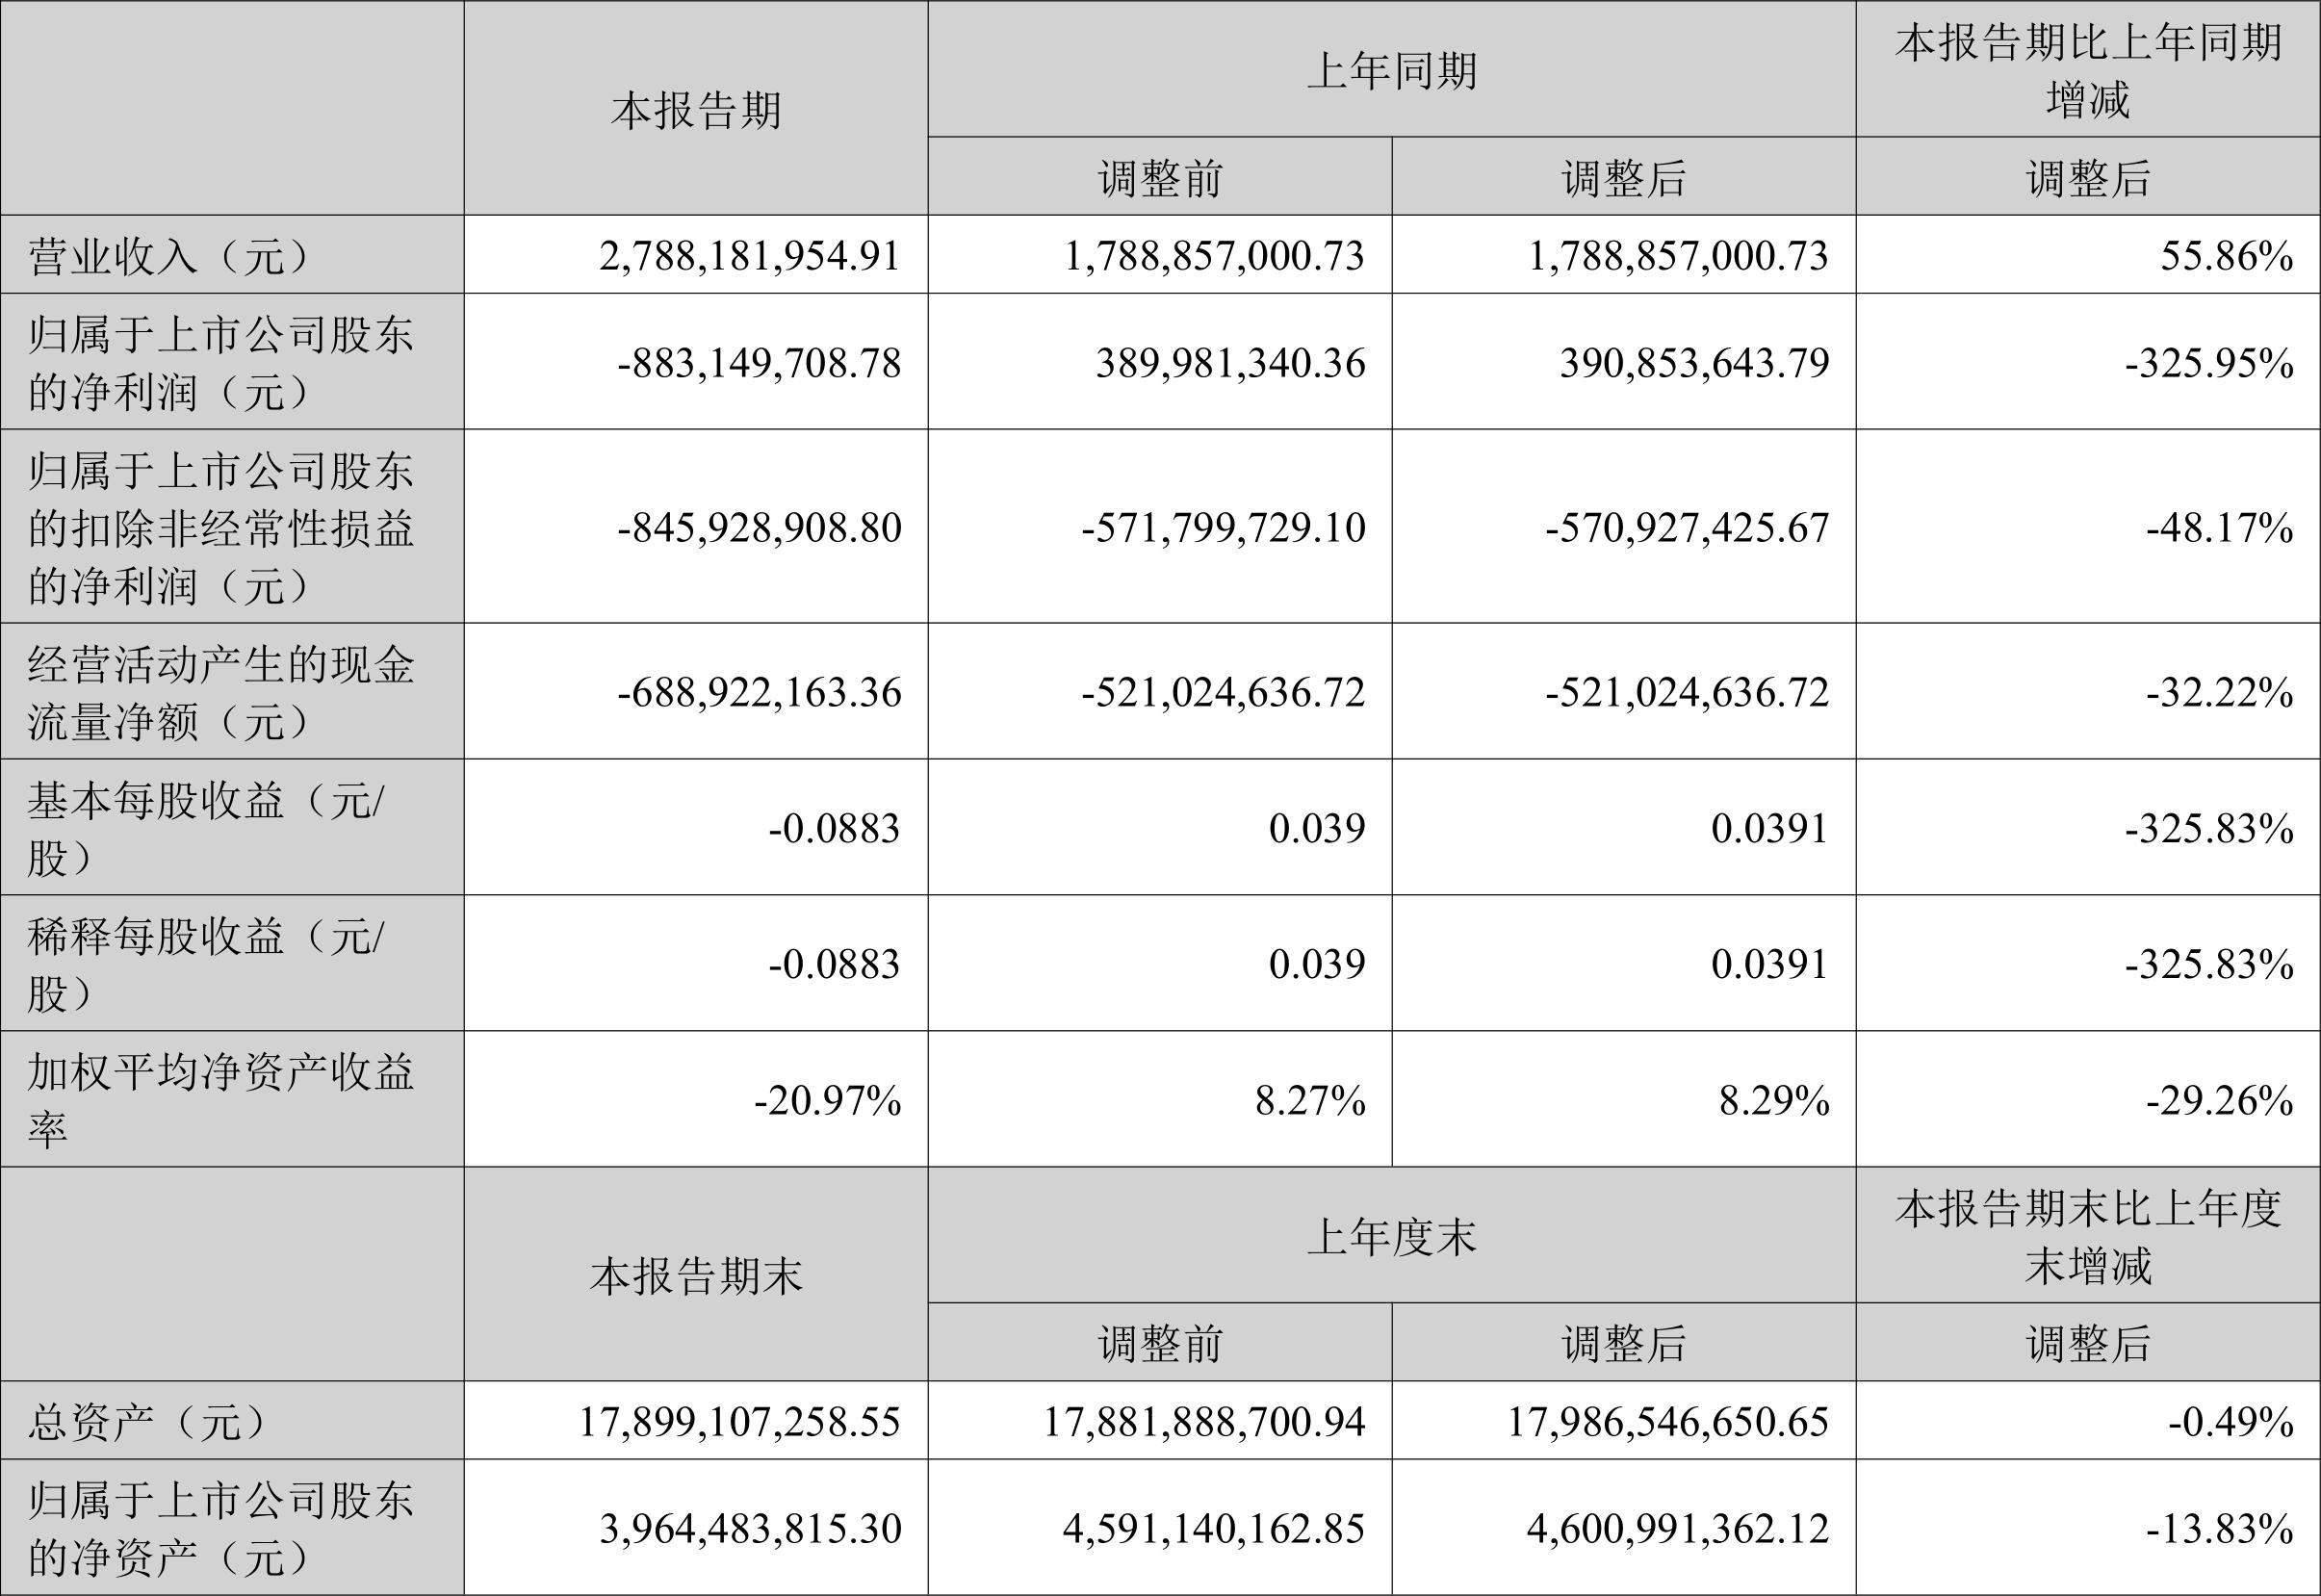
CSI Intelligent Financial Information Shanzi Co., Ltd. (000981) disclosed its 2023 semi-annual report on August 31. In the first half of 2023, the company achieved total operating income of 2.788 billion yuan, a year-on-year increase of 55.86%; net profit attributable to the parent company was a loss of 883 million yuan, a profit of 391 million yuan in the same period last year; a loss after deducting non-net profits was 846 million yuan, a loss of 5 in the same period last year .71 billion yuan; net cash flow generated from operating activities was -689 million yuan, compared with -521 million yuan in the same period last year; during the reporting period, Shanzi's basic earnings per share was -0.0883 yuan, and the weighted average return on net assets was -20.97%.
Based on the closing price on August 30, Shanzi's current price-to-earnings ratio (TTM) is approximately -6.82 times, its price-to-book ratio (LF) is approximately 3.86 times, and its price-to-sales ratio (TTM) is approximately 3.23 times.
The historical quantile charts of the company's price-to-earnings ratio (TTM), price-to-book ratio (LF), and price-to-sales ratio (TTM) in recent years are as follows:
According to the semi-annual report, the company achieved total operating income of 1.632 billion yuan in the second quarter, a year-on-year increase of 256.28% and a month-on-month increase of 41.23%; net profit attributable to the parent company was -686 million yuan, a year-on-year decrease of 730.02%, and a month-on-month decrease of 248.05%; deducting non-net profit was -651 million yuan, a year-on-year decrease of 131.87%, and a month-on-month decrease of 234.33%.
The semi-annual report shows that during the reporting period, the company's main business was high-end manufacturing, mainly engaged in the R&D, production and sales of automotive automatic transmissions, electrified powertrain systems and automotive passive safety core components. Among them: Belgian Punch Company mainly produces automotive automatic transmissions and other products, focusing on the R&D and production of hybrid and pure electric powertrain systems. It has the highest R&D and technical level in related fields. Ranking at the forefront of the world, it has now formed a full range of product lines including continuously variable transmissions CVT, dual-clutch transmission DT1, hybrid dual-clutch transmission DT2, pure electric vehicle EV reducers, three-in-one and multi-in-one electric drive systems and their core components; American ARC Company is the world's largest manufacturer of hybrid gas generators, mainly dedicated to the development, production and sales of automotive airbag gas generators. In addition, the company has been deeply involved in the real estate field for more than 20 years, and has the advantages of comprehensive industry chain services such as comprehensive development, sales, property management, commercial management, and star hotels in the real estate field.
In terms of products, among the company's main businesses in the first half of 2023, automotive transmission revenue was 939 million yuan, a year-on-year increase of 61.53%, accounting for 33.67% of operating revenue; automotive airbag gas generator revenue was 696 million yuan, a year-on-year increase of 22.73%, accounting for 24.97% of operating revenue; real estate sales revenue was 621 million yuan, a year-on-year increase of 287.54%, accounting for 22.26% of operating revenue.
In the first half of 2023, the company's gross profit margin was 11.41%, a year-on-year increase of 6.35 percentage points; the net profit margin was -34.48%, a decrease of 54.65 percentage points from the same period last year. Judging from single-quarter indicators, the company's gross profit margin in the second quarter of 2023 was 8.50%, a year-on-year decrease of 3.56 percentage points, and a month-on-month decrease of 7.02 percentage points; the net profit margin was -45.61%, a decrease of 23.33 percentage points from the same period last year, and a decrease of 26.87 percentage points from the previous quarter.
In terms of products, the gross profit margins of automobile transmissions, automobile airbag inflators, and real estate sales in the first half of 2023 were 12.57%, 14.65%, and 2.01% respectively.
Data shows that the company's weighted average return on net assets in the first half of 2023 was -20.97%, a decrease of 29.24 percentage points from the same period last year; the company's return on invested capital in the first half of 2023 was -5.31%, a decrease of 8.86 percentage points from the same period last year.
In the first half of 2023, the company's net cash flow from operating activities was -689 million yuan, a year-on-year decrease of 168 million yuan; net cash flow from financing activities was 466 million yuan, a year-on-year decrease of 146 million yuan; net cash flow from investing activities was -140 million yuan, compared with -949 million yuan in the same period last year.
Further statistics found that the company's free cash flow in the first half of 2023 was -245 million yuan, compared with -518 million yuan in the same period last year.
In the first half of 2023, the company's operating income to cash ratio was 72.92%.
In the first half of 2023, the company's period expenses were 970 million yuan, an increase of 326 million yuan from the same period last year; but the period expense rate was 34.79%, a decrease of 1.22 percentage points from the same period last year. Among them, sales expenses increased by 7.27% year-on-year, administrative expenses increased by 41.12% year-on-year, research and development expenses increased by 100.4% year-on-year, and financial expenses increased by 49.56% year-on-year.
In terms of major changes in assets, as of the end of the second quarter of 2023, the company's monetary fund balance decreased by 39.16% from the end of the previous year, accounting for a decrease of 2.40 percentage points in the company's total assets; intangible assets increased by 9.13% from the end of the previous year, accounting for the company's total assets The proportion increased by 1.79 percentage points; the inventory balance decreased by 7.44% from the end of the previous year, and the proportion of the company's total assets decreased by 1.46 percentage points; accounts receivable increased by 40.06% from the end of the previous year, and the proportion of the company's total assets increased by 1.39 percentage points.
In terms of major changes in liabilities, as of the end of the second quarter of 2023, the company's non-current liabilities due within one year increased by 14.32% from the end of the previous year, accounting for an increase of 2.80 percentage points in the company's total assets; long-term borrowings decreased by 23.22% from the end of the previous year, accounting for the company's total assets The proportion of total assets decreased by 1.62 percentage points; contract liabilities decreased by 31.76% from the end of the previous year, and the proportion of the company's total assets decreased by 1.05 percentage points; accounts payable increased by 9.14% from the end of the previous year, and the proportion of the company's total assets increased by 0.80 percentage points.
In terms of solvency, the company's asset-liability ratio at the end of the second quarter of 2023 was 73.12%, an increase of 3.73 percentage points from the end of the previous year; the interest-bearing asset-liability ratio was 32.96%, an increase of 0.84 percentage points from the end of the previous year.
In the first half of 2023, the company's current ratio was 0.59 and its quick ratio was 0.25.
The semi-annual report shows that among the company's top ten tradable shareholders at the end of the first half of 2023, the new shareholders are Xiong Jikai, Zhu Xiaoxiong, and Tianfeng Securities Co., Ltd., replacing Hangzhou Yinchen Real Estate Co., Ltd., Great Wall Guoxing Financial Leasing Co., Ltd., and Yan Guobing at the end of the first quarter. In terms of specific shareholding ratio, Ningbo Yinyi Holdings Co., Ltd.’s shareholding has declined.
Name of shareholder Number of shares held (10,000 shares) Proportion of total share capital (%) Change ratio (%)
Special account for property disposal of bankrupt enterprises of Yinyi Co., Ltd.
91064.92
9.108796
constant
Xiong Jikai
68895.73
6.891316
New
Ningbo Yinyi Holdings Co., Ltd.
55456.18
5.547021
-1.45
Ningbo Development Investment Group Co., Ltd.
46087.75
4.609941
constant
Lu Guohua
10300
1.030261
constant
Industrial and Commercial Bank of China Co., Ltd. Ningbo Branch
9982.26
0.998478
constant
Ping An Bank Co., Ltd.
4829.15
0.483037
constant
Zhu Xiaoxiong
3650
0.365092
New
Tianfeng Securities Co., Ltd.
3545
0.35459
New
Chang Wenguang
2864.37
0.28651
constant
It is worth noting that according to semi-annual report data, 27.13% of Shanzi shares are in a pledged state. Among them, Ningbo Shengzhou Investment Co., Ltd., the second largest shareholder, pledged 900 million company shares, accounting for 97.50% of its total shareholding.
In terms of chip concentration, as of the end of the second quarter of 2023, the total number of shareholders of the company was 48,600, a decrease of 4,949 households, or 9.25%, from the end of the first quarter; the average shareholding value per household dropped from 336,200 yuan at the end of the first quarter to 314,900 yuan, a decrease of 6.34%.
Indicator notes:
Price-to-earnings ratio = total market value/net profit. When the company is losing money, the price-to-earnings ratio is negative. At this time, using the price-to-earnings ratio for valuation has no practical significance. The price-to-book ratio or the price-to-sales ratio is often used as a reference.
Price-to-book ratio = total market value/net assets. The price-to-book ratio valuation method is mostly used for companies with large earnings fluctuations but relatively stable net assets.
Price-to-sales ratio = total market value/operating income. The price-to-sales valuation method is often used for growth companies that are losing money or making only a small profit.
The price-to-earnings ratio and price-to-sales ratio in this article adopt the TTM method, which is calculated based on the 12-month data as of the latest financial report (including forecast). The price-to-book ratio adopts the LF method, which is calculated based on the latest financial report data.
When the P/E ratio is negative, the current period quantiles are not displayed, which will cause the line chart to be interrupted.